
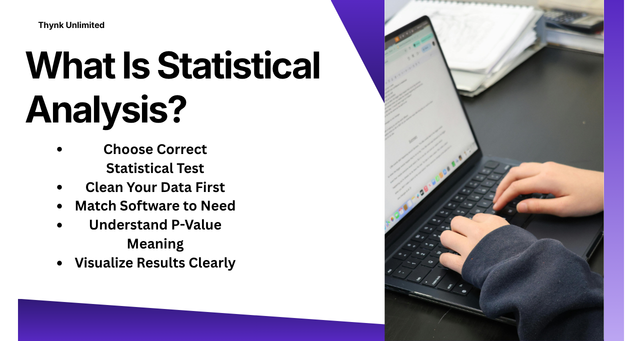
When you first encounter the statistical analysis, it seems daunting. You start your research paper or thesis project and suddenly you come across terms such as regression analysis, hypothesis testing and standard deviation. You’re in a panic, as you don’t know where to begin. This guide takes statistical analysis through step-by-step processes that anyone can follow, and will help you feel confident in your ability to manage your data and complete your project on time.
What Is Statistical Analysis?
Statistical analysis is the process of gathering, arranging and summarizing numerical data for the purpose of finding patterns that make sense. It is used for research to test theories, for student assignments, and for business decisions. Every time you use statistics to make predictions, to compare groups, to find averages, you are using statistical methods.
Data analysis is a part of every research paper, thesis, or dissertation. Your professor expects more than just numbers, he/she expects you to show some insight. This is where most students get stuck!
Why Students Struggle With Statistical Analysis
If the statistics are confusing, don’t worry, you’re not alone. Here are some typical pain points most of the students have to deal with:
- Selecting the Appropriate Statistical Test One doesn’t always know which statistical test to choose: t-test, ANOVA, or chi-square test. If you select the incorrect approach, you’re wasting precious hours and your entire analysis is ruined.
- Software Confusion: You’re having issues with SPSS analysis, R programming with statistics, or Python with statistical analysis, due to steep learning curves. The software takes more time than you spend trying to analyze your data.
- You have computed a p-value without an understanding of its significance for your research. Even advanced students get confused about what is meant by statistical significance when they first learn about hypothesis testing.
- Data Visualization Problems You have excellent data, but you are not able to use it to communicate effectively. Unhelpful data visualization will make it more difficult for you to understand your findings and affect your grade..
- Deadline Concerns Your statistical data analysis services or academic papers are due. Learn statistical modeling from scratch under pressure – unnecessary stress.
- Errors of sample size calculation – you frequently do not calculate the sample size properly and thus your study is weakened. Papers are turned down if the size is too small to substantiate the conclusions.
If you are a victim of any of these, this guide can help you in a step by step manner.
Core Statistical Methods Every Student Should Know
Descriptive Statistics
All analyses begin with descriptive statistics. This includes determining the mean, median, mode and standard deviation. These numbers provide an overview of your dataset and can help you get a quick overview before analysing it in detail.
Inferential Statistics
Inferential statistics make inferences about a larger population from a sample. This branch covers hypothesis testing, calculation of confidence limits, and calculation of probability distributions.
Regression Analysis
Regression analysis is used when you want to know about relationship between the variables. You might learn about how studying time relates to exam performance, for instance. Use regression analysis to make predictions and find good correlations.
Correlation Analysis
Correlation analysis is used to determine the strength of the relationship between two variables. However, a strong correlation is not necessarily a cause-and-effect relationship; so be careful in interpreting the results.
Hypothesis Testing
A statistical significance level is used to test a null hypothesis against an alternative hypothesis. The t-test analysis, chi-square test, and ANOVA (analysis of variance) are common tests used. The tests are tailored to various types of data and research questions.
Predictive Analysis
Predictive analysis is used to predict possible outcomes from historical data. This method is widely used in quantitative analysis projects by businesses and researchers.
Best Statistical Software for Students
Don’t become an expert on all the tools! Keep in mind what suits a project:
- SPSS Analysis – The most suitable for start with analyzing survey data and research in social sciences.
- R Programming Statistics – Perfect tool for higher-level statistical modeling and custom visualizations.
- Python Statistical Analysis – Ideal for those who also want to create machine learning models along with their statistics.
- Excel – very useful for descriptive statistics and simple charts.
The software to analyze your data should depend on how comfortable you are and your department’s needs, as well as the sophistication of your statistical analysis.
Step-by-Step Approach to Statistical Analysis
Step 1: Formulate a Research Question: First you should formulate a research question before you start using any of the data analysis tools. If a question is unclear, so will be the answer.
Step 2: Collect Clean Data: Carefully gather your data, and look for errors, missing data values, and outlier values before performing any statistical tests.
Step 3: Select Appropriate Statistical Test Match data type and research question with appropriate statistical test. This choice will affect the validity of your entire study.
Step 4: Conduct Analysis Conduct your selected test in SPSS, R, Python or Excel. Record all the steps to show how to do it later.
Step 5: Interpret the results You explain the meaning of your p-value, correlation coefficient or regression output in the context of your research.
Step 6: Visualize and Present You will prepare clear charts and graphs; your audience will be able to understand your findings at a glance. Effective data visualization can make your final report stronger.
Common Mistakes Students Make
You are in a hurry to clean up the data and the results are incorrect. You also misunderstand the meaning of statistical significance; if you get a low p-value you must conclude that your theory is correct. A common error is failing to consider the number of samples, which makes the study less credible. Also, be careful not to confuse the term correlation with causation, which is seen in many student papers each year.
Tips to Simplify Statistical Analysis
Stress can be minimized if you work on a project in stages rather than all at once. It is also advised to work through example data sets prior to the actual research data. As you watch tutorials and get more and more familiar with the statistical testing and statistical modeling, your confidence increases over time. If you still feel like you are stumped, you can also get statistical data analysis services or ask your professor for some guidance earlier rather than later.
Conclusion
You don’t need to be afraid of statistical analysis. Once you know the basic statistical methods, how to select the appropriate statistical software, and the proper step-by-step process, you will become more confident. Know how to mean your data, which statistical methods to use and how to present your results in a clear manner. After some practice, you’ll be able to take care of any kind of statistical data analysis project with ease and submit work that’ll impress your professors.